| |
|
| |
Aurthors/المؤلفون
Abstract/الملخص
Keywords/الكلمات المفتاحية
Content/أقسام الملف
1- Introduction
2- Method and material
3- Results and interpretation
4- Conclusion
5- References |
| Conception and realization of a medical audiometer |
| |
| |
| Sidi.Ahmed Taouli |
| Department of biomedical genius, Faculty of technology, University Aboubekr-Belkaid |
| sidiahmed.taouli@univ-tlemcen.dz |
| |
| |
|
|
Abstract
Our system consists of making a device named audiometer. It allows identifying and determining quantitatively the degree of hearing loss which is represented in decibel by measuring the auditory sensitivity of a person subjected to different types of acoustic stimulation. These measurements are performed with sounds that represent a sound stimulus, which refers to tonal audiometry. Auditory thresholds are determined based on the patient's response. An acquisition card has been added to the system, it is the Arduino card that displays the frequency at which the sound is audible.
The results obtained from these tests are written on a curve called an audiogram. During these curves, the doctor will know the pathology. |
|
|
|
| Keywords: Template, conference |
|
| |
|
| |
|
| 1- Introduction |
|
In the past, to control the auditory sensitivity, a tuning fork, which was previously vibrated, was slowly approaching the ear until the patient perceived the sound. By measuring the distance between the tuning fork and the ear, the degree of deafness could be determined [1]. The use of therapeutic tuning forks began in Italy in 1550 as a diagnostic tool for middle and inner ear conditions. As time passed, the technique developed in England, Germany, and France around 1840 [2].
There are other tests using a tuning fork, described at the turn of the 20th century. Most of them disappeared with the development of audiometry.
Over time, the tuning fork was replaced by an electronic sine wave generator able to provide all the frequencies of the audio range [1].
After the development of the induction coil in 1849 and audio transducers (telephone) in 1876, a variety of audiometers were invented in the United States and abroad. These first audiometers were designed as coil induction audiometers.
The paternity of the audiometer is attributed to the physicist Harvey Fletcher. The first audiometer was developed in 1878 by the musician Arthur Hartmann, in Germany. The audiometer name was given by Benjamin Richardson in 1879 from Latin etymological roots. In 1922, the measurement program was added to the recently invented audiogram [3].
Harvey Fletcher, an American acoustic physicist, discusses his contribution to the theory of speech perception. He demonstrated that the elements of speech are usually distributed over a wide frequency range, and that they are treated independently through different frequency bands.
He also dedicated a significant part of his work to the study of loudness, and showed that Weber-Fechner's law also applies to hearing [4].
The audiometer is from the inventor Alexander Graham Bell. Alexander's mother and wife were deaf, which encouraged Bell to devote his life to learning to speak to the deaf. His research on hearing and speech led him to build hearing aids. Bell's concern about his mother's deafness led him to study acoustics [5].
Like Beltone's audiogram, one of their triumphs of the crowned audiometer was equipped with an incredible number of buttons. The first task before the audiometer could be used was to learn the functions and locations of the individual buttons. Once this task was mastered, the accomplished professional could then show this audiometer with pride [6].
The modern audiology industry is from the end of the Second World War, when hearing loss related to battle was widespread. Direct physical injuries caused by shrapnel and acoustic trauma from high intensity artillery and gun noise were common causes of hearing loss.
In the years following the Second World War, hearing rehabilitation centers were opened throughout the country, with the mission of preserving hearing, diagnosing and rehabilitating hearing loss, and providing educational and vocational placement services for children the hearing impaired [7]. |
|
| |
|
| Method and material |
|
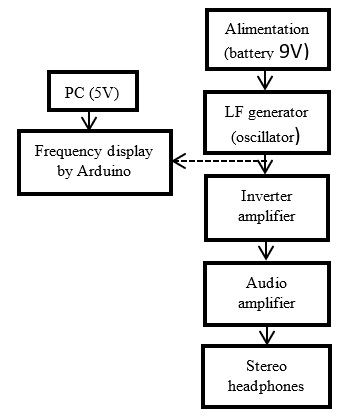
| The block diagram of our audiometer consists of seven steps which are presented in the following figure: |
|
| |
|
 |
|
| Figure 1. Block diagram of audiometer |
|
| |
|
To make an audiometer, you need a Low Frequency (LF) generator capable of outputting a perfectly sinusoidal wave with a very low distortion and constant amplitude over the entire audio range from 20 to 25,000 hertz approximately [1].
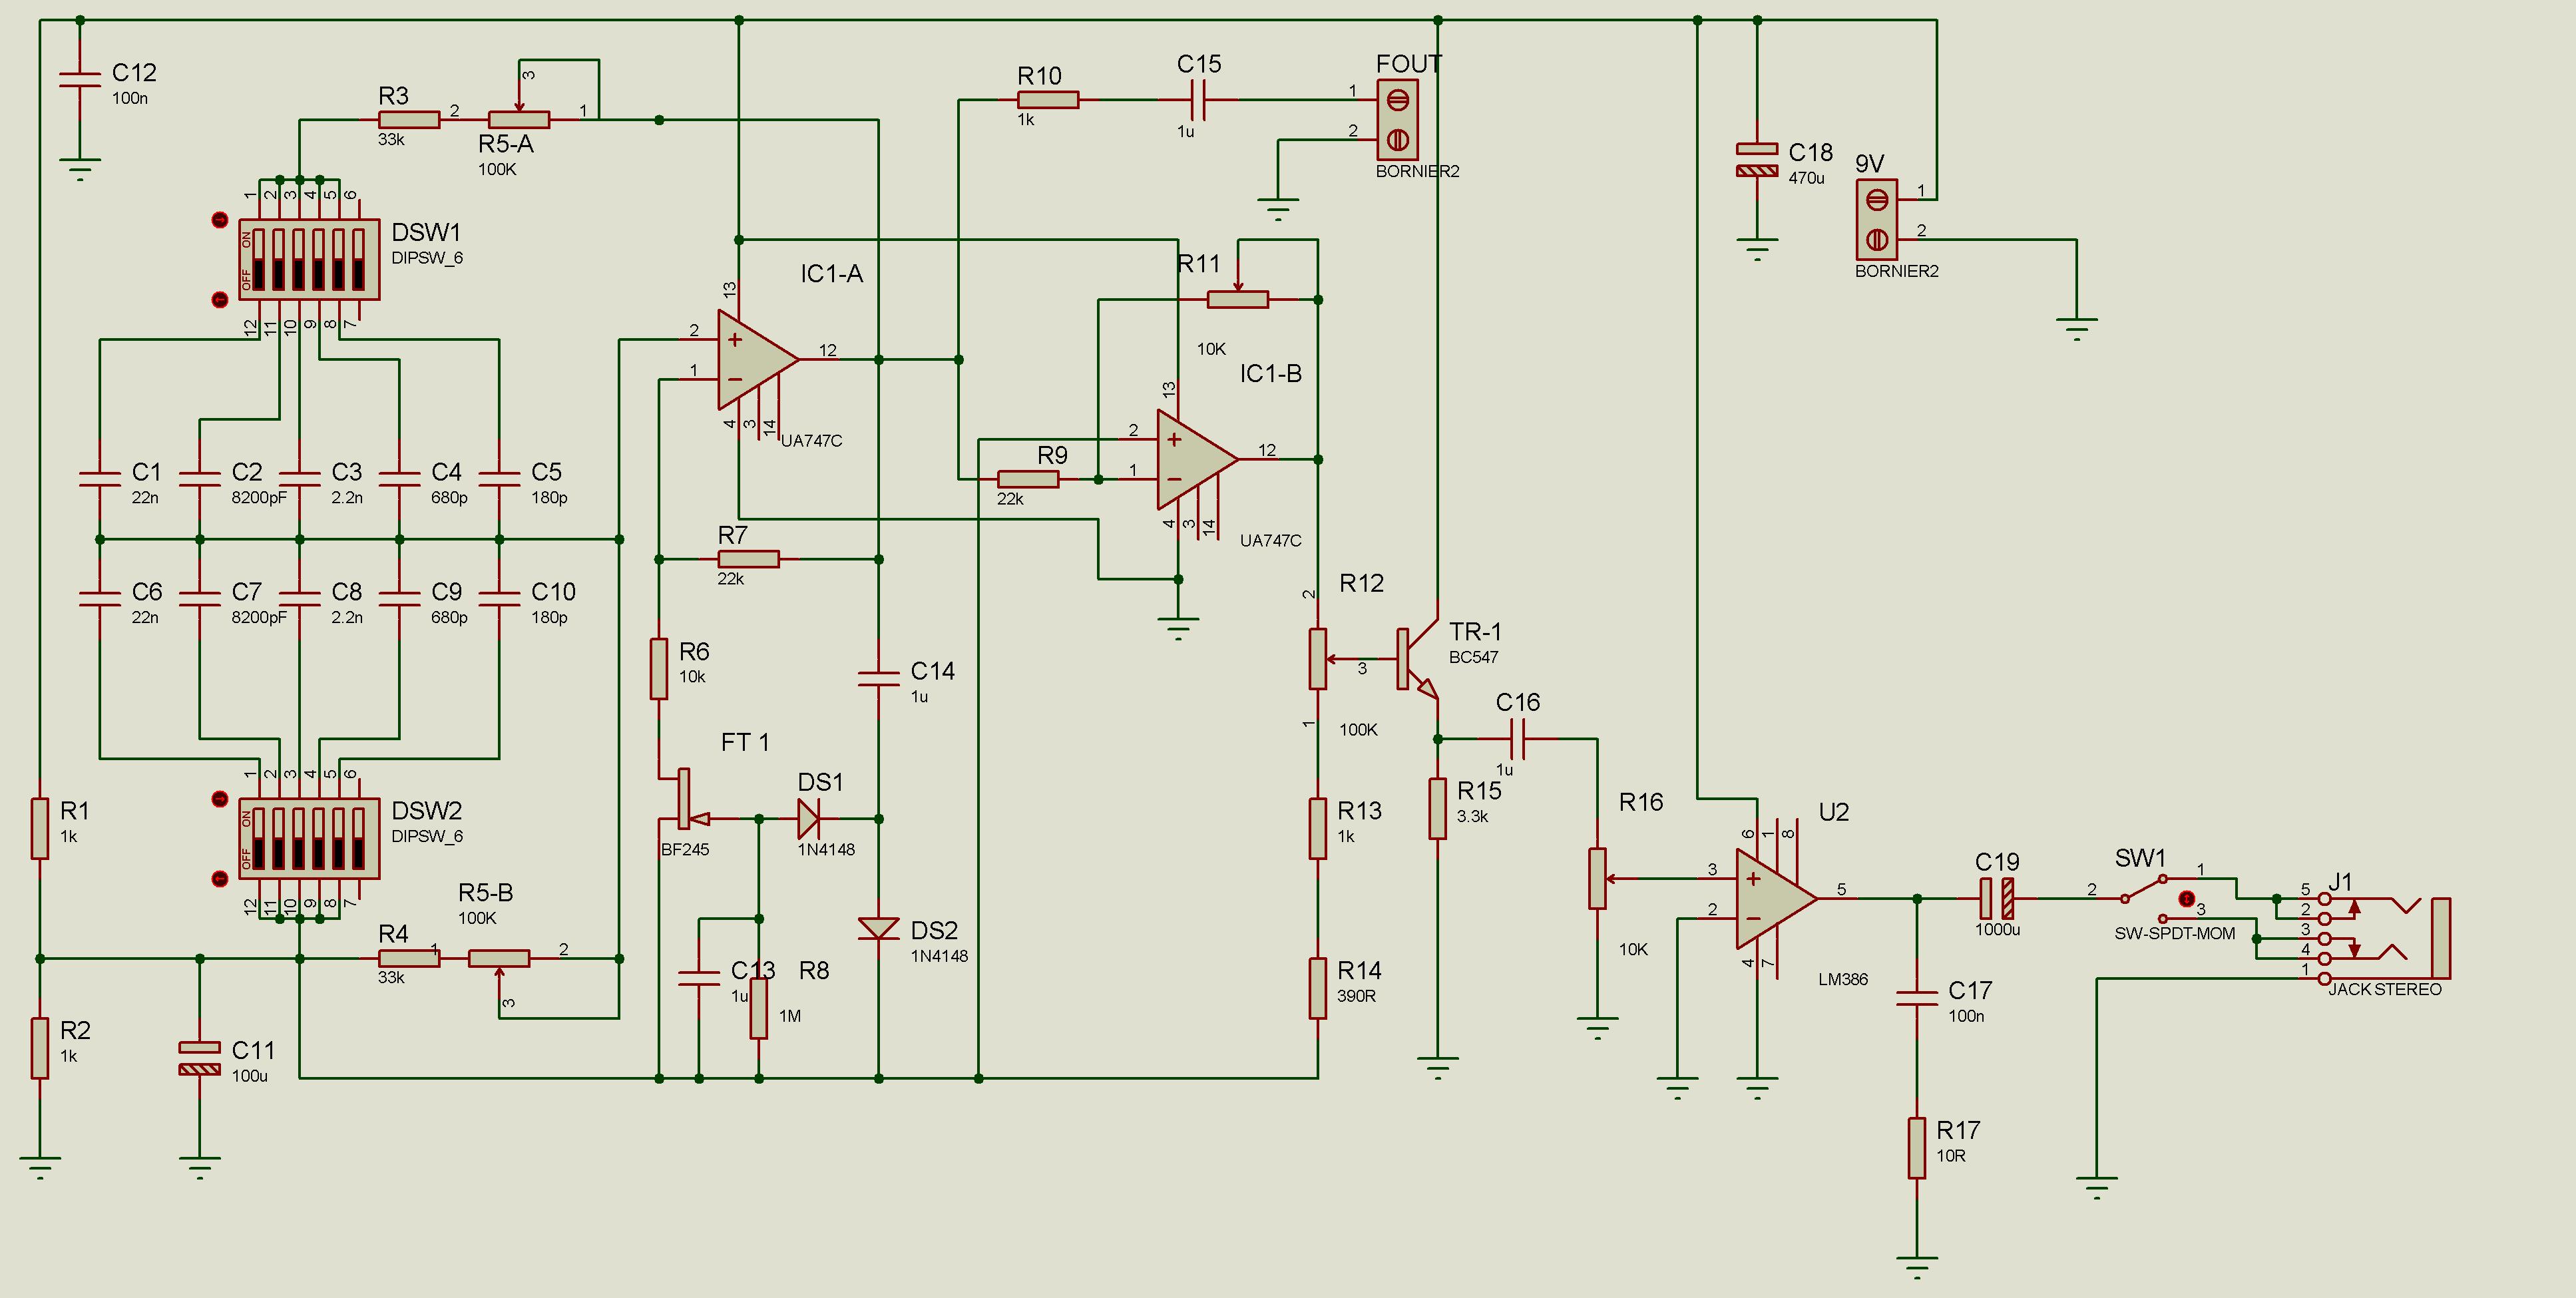
The following figure 2 represents the electrical diagram of our audiometer. |
|
| |
|
 |
|
| Figure 2. Electrical Diagram of Medical Audiometer |
|
| |
|
A LF generator is a linear oscillator whose function is to produce a sinusoidal signal.
The oscillation condition known as the Barkhausen criterion is therefore: A.B = 1. (The Barkhausen stability criterion is a condition that a harmonic oscillator oscillates and determines its oscillation frequency f0 [8]).
The signal LF present on the output pin of the first Aop (IC1-A) arrives through R9 on the inverting input pin of the second Aop (IC1-B) which amplifies it and the dose. So, IC1-B is an inverting amplifier with gain = -R_11/R_9
The audio amplifier is an electronic amplifier used to amplify an audio electrical signal to obtain sufficient power to operate an audio headset.
From the output pin of this integrated circuit (LM386), the signal is taken by C19 for is transferred, through the inverter (SW1), either on the right ear or on the left ear to check if both ears have the same sensitivity [9].
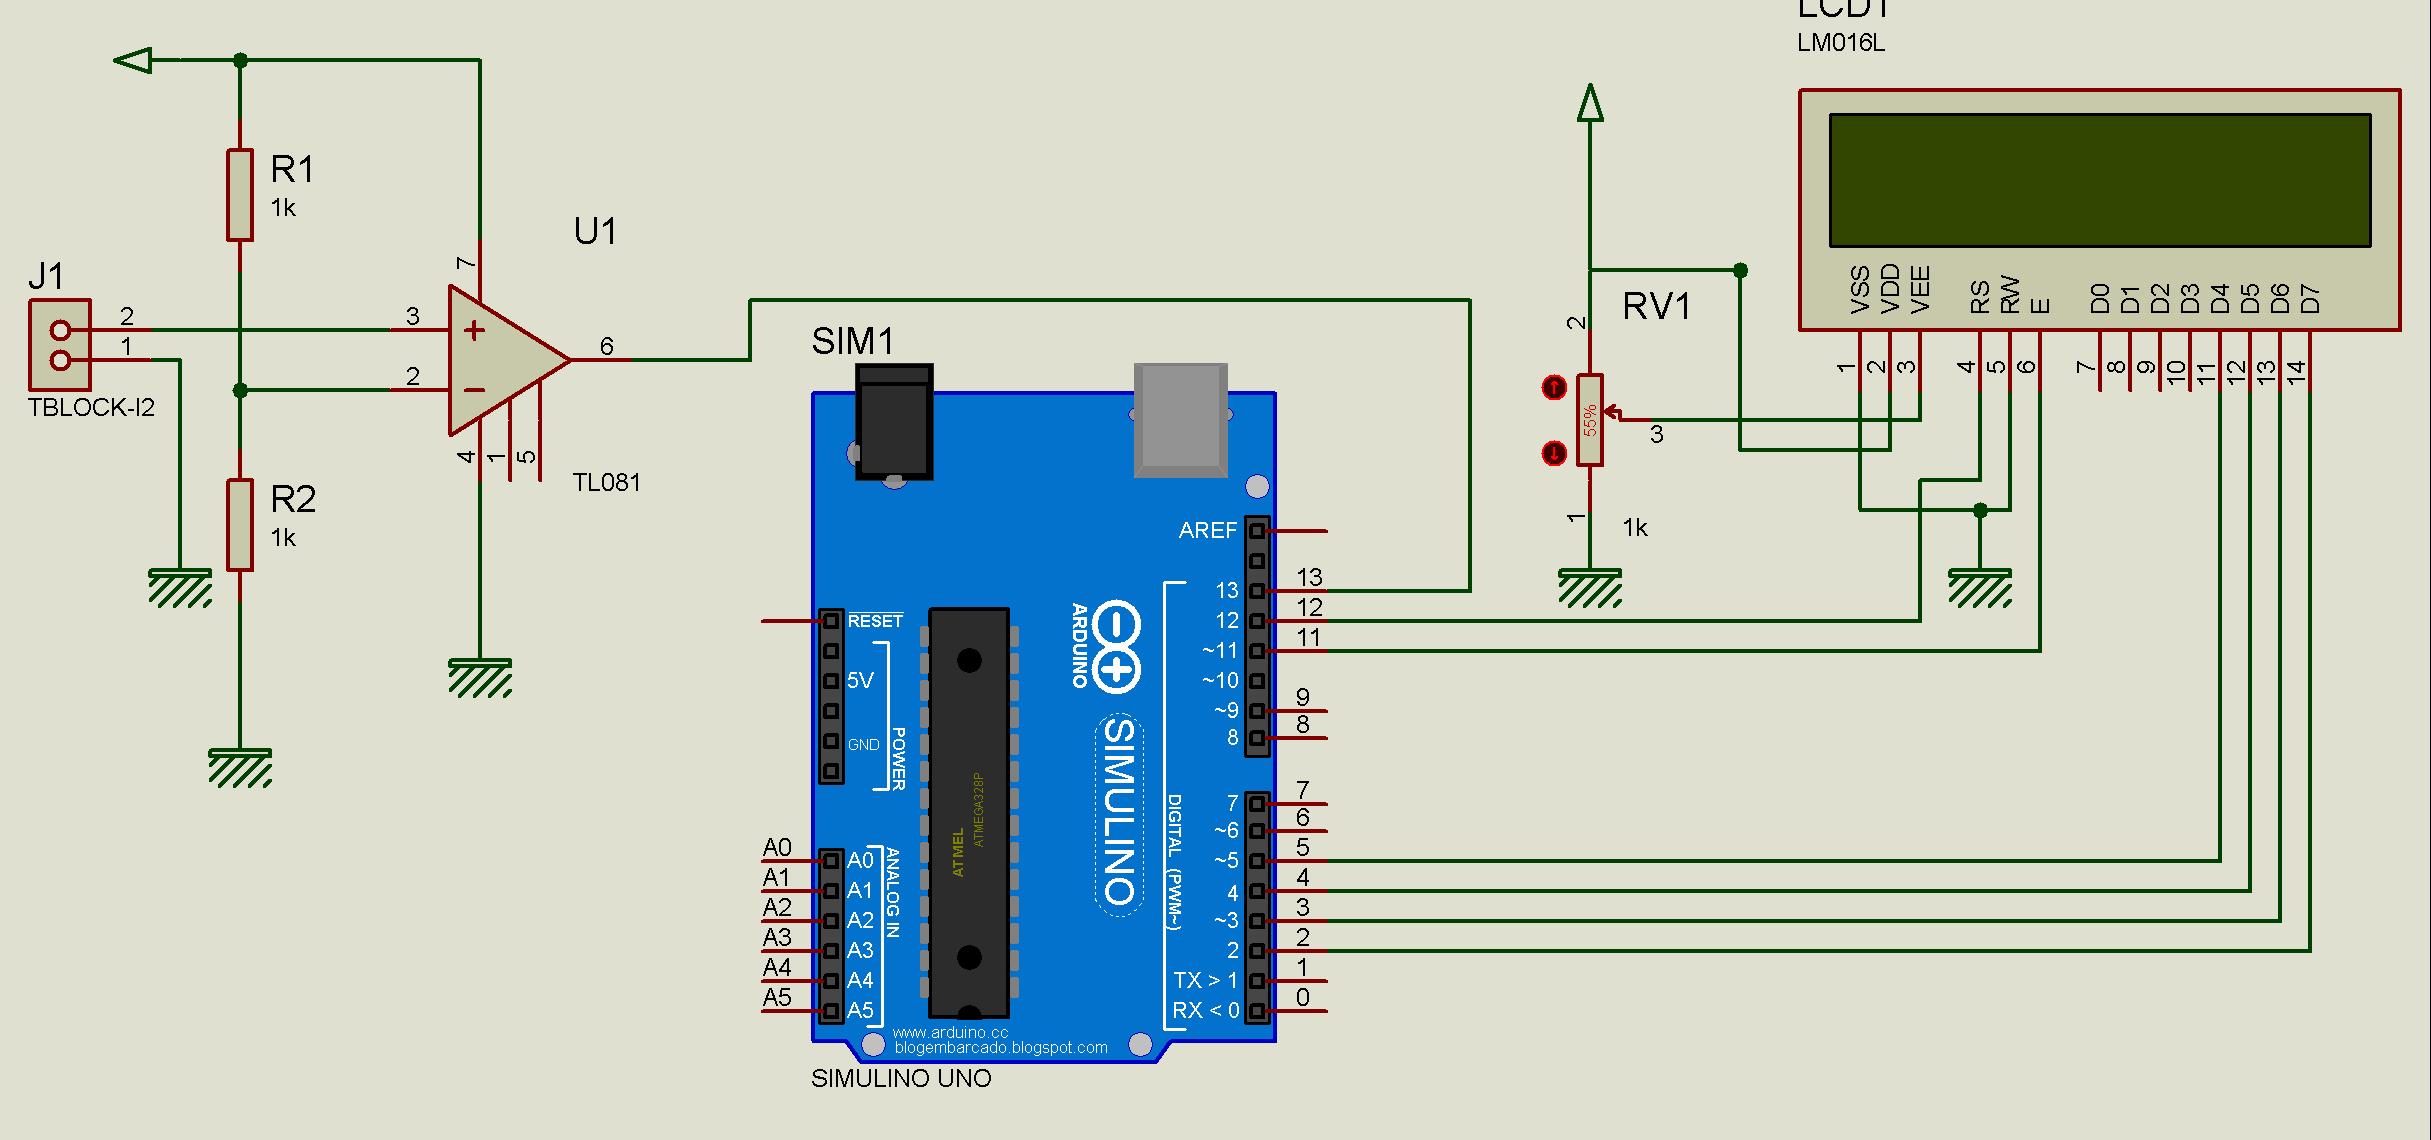
The most complete part of the study of our audiometer is relative to the Frequency Meter which is based on the use of the Arduino board and Liquid cristal display (LCD).
The following shows the oscillation frequency display circuit that is based on the Arduino board. This frequency is displayed on an LCD: |
|
| |
|
 |
|
| Figure 3. Electrical diagram of the Frequency meter |
|
| |
|
| This circuit is based on the use of the Arduino board and the LCD display, we have powered the Arduinopar board the USB cable that is connected with the pc (5 V) .When the value of the oscillation frequency changes, the value that is displayed on LCD will change in parallel. |
|
| |
|
 |
|
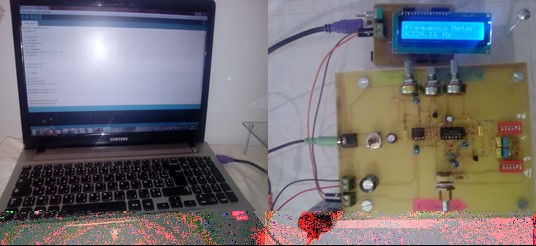
| Figure 4. The display circuit that is powered by the PC (5 V) |
|
| |
|
| Results and interpretation |
|
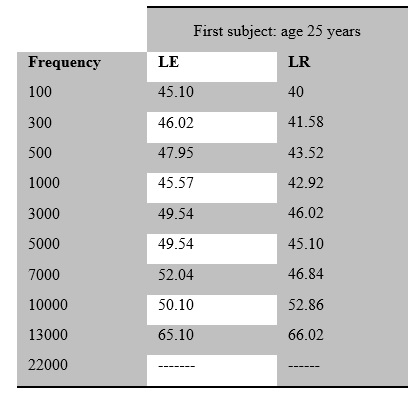
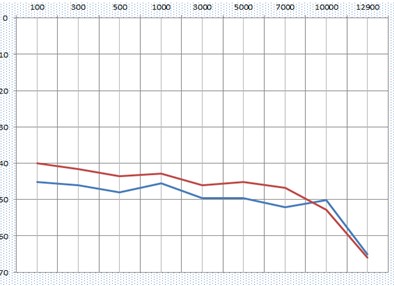
The sound is sent to the ear by a headset placed on the head of the patient, then, thanks to an inverter, is applied alternately on a single earphone the signal LF, so as to assess the difference in sensitivity that may exist between the two ears. Each ear is tested separately. This makes it possible to measure the air conduction. The generator must be tuned to reference frequencies, for example 100 - 300 - 500 - 1,000 - 3,000 - 5,000 - 7,000 - 10,000 - 13,000 Hertz, then, for each of these frequencies, the knob is turned slowly of volume, from its minimum to its maximum, until the subject hears the acoustic note and raises his hand. The audiometer delivers pure sounds ranging from low to high pitched sounds at increasing intensities starting from 0 dB (the minimum intensity that triggers a sound perception for all frequencies. The audiogram is a graph that gives a detailed description of a person’s hearing ability. It represents the auditory threshold, that is to say the weakest sounds that this person can hear at different frequencies. The horizontal axis represents the sound volume measured in Hz. The more you move to the right, the more the sounds examined are acute. Frequencies between 500 Hertz and 3000 Hertz, are considered normal conversation. The vertical axis of the audiogram represents the sound volume or intensity that is expressed in dB. The further you descend on the axis, the louder the sound and the loss is important.
dB=20*〖log〗_10 (V_measured) (1)
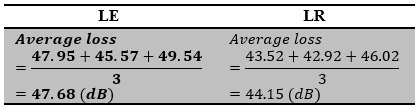
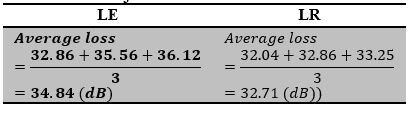
To estimate the hearing loss caused by a decrease in the hearing of a person, the deafness is classified according to the average loss. The average loss is calculated by adding the measured hearing loss for the frequencies 500, 1000 and 3000 Hertz and then divided by 3. This calculation is done for each ear. To test our audiometer, we applied the audiometry test on four different subjects, and then we took the intensity and frequency values corresponding to the sound wave heard by each ear as follows:
We notice: LE: for the left ear, LE: for the right ear.
(----): the dashes mean that there is not a perception of sound that is acute or severe.
From the results of the previous table 2, we see that the average loss of the left ear and that of the right ear, are greater than 40 dB, and between 40 and 70 dB, so we concluded that subject 1 has average deafness. |
|
| |
|
| Table 1. Intensity measurement |
|
 |
|
| |
|
| Table 2: Calculation of the average loss of the first subject |
|
 |
|
| |
|
| |
|
 |
|
| Figure 5. Audiogramm of the first subject (Red: LR- Blue: LE) |
|
| |
|
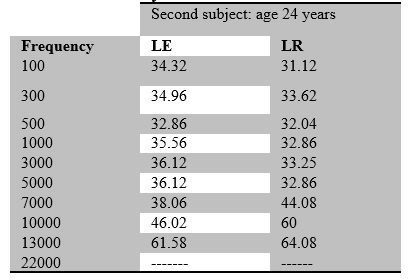
| Table 3. Intensity measurement |
|
 |
|
| |
|
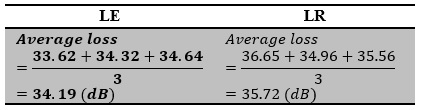
| Table 4. Calculation of the average loss of the second subject |
|
 |
|
| |
|
| From the results of the previous table 4, we see that the average loss of the left ear and that of the right ear are between 20 and 40 dB, so we concluded that the subject 2 has a slight deafness. |
|
| |
|
| Table 5. Intensity measurement |
|
 |
|
| |
|
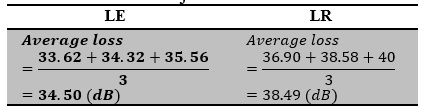
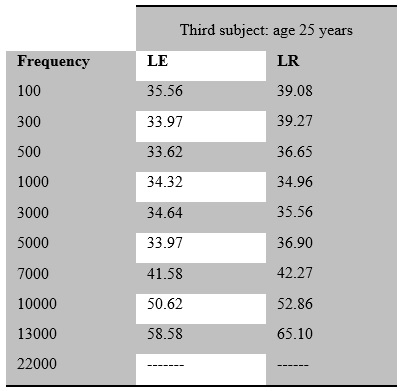
| Table 6. Calculation of the average loss of the third subject |
|
 |
|
| |
|
From the results of the table 6, we see that the average loss of the left ear and that of the right ear are between 20 and 40 dB, so we concluded that the subject 3 has a slight deafness.
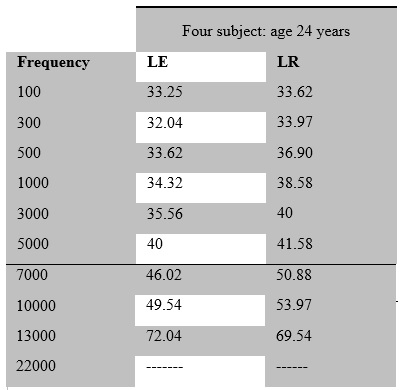
Column reading of table 8, we see that the average loss of the left ear and that of the right ear are between 20 and 40 dB, so we concluded that the subject 4 has a slight deafness.
We concluded that the different subjects tested are not all equally sensitive to the full audio range (ie each subject has an auditory sensitivity) and that an ear may be a little duller than the other. |
|
| |
|
| Table 7. Intensity measurement |
|
 |
|
| |
|
| Table 8. Calculation of the average loss cru of the fourth subject |
|
 |
|
| |
|
| Conclusion |
|
The realization of a medical audiometer is constituted of two basic steps: the first consists of the realization of the audiometer card and the second to the realization of a display circuit based on an LCD display which is connected to an Arduino board. The device thus produced then allows, through simple electronic circuits, to measure the threshold of audibility and to determine the sensitivity of the human ear. This work allowed us a better understanding of the auditory system, the different physical and physiological mechanisms of hearing and different auditory exploration techniques.
We realize our audiometer based on a sinusoidal oscillator consisting of an operational amplifier using a field effect transistor and a feedback circuit to select the frequency. And another circuit that displays the selected frequency. The audiometer is very important because it allows constant monitoring of hearing. Depending on the results obtained by the test on different subjects (audiograms), we will be able to evaluate their hearing and their levels of impairment. On a hearing-impaired subject, he will be able to appreciate the usefulness of a hearing aid and guide it towards proper management. |
|
| |
|
| References |
|
1. Information on http://www.electronique-magazine.com. N°30, 2001, pp. 64-69.
2. Information on https://fr.wikipedia.org/wiki/Sonthérapie
3. Information on https://fr.wikipedia.org/wiki/Audiom%C3%A8tre
4. Information on https://fr.wikipedia.org/wiki/Harvey_Fletcher.
5. Information on https://fr.wikipedia.org/wiki/Alexander_Graham_Bell.
6. Information on http://hearinghealthmatters.org/waynesworld/2015/audiometer-evolution/.
7. Information https://www.embracehearing.com/blogs/hearingaidsnews/5903159-a-brief-history-o
f-hearing-aids-part-i-the-audiometer.
8. GUILLOTIN F. (2014). Les Oscillateurs en Electronique,Institut National des Sciences Appliquées. P6,STPI/P6, 033.
9. Information on http://www.electronique-magazine.com. N°109, 2009, pp. 32-42 |
|
| |
|
| |
|
| |
|


